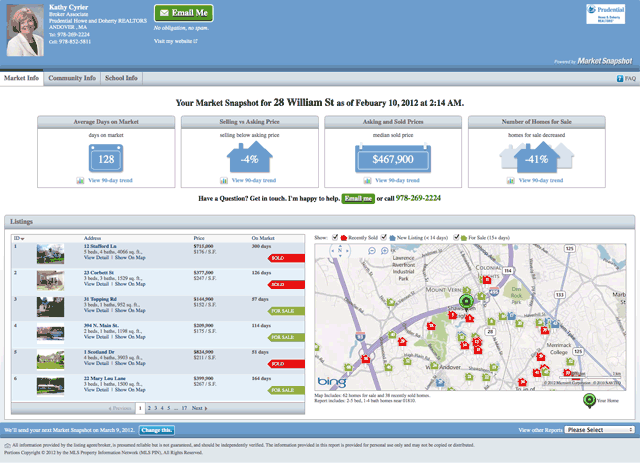
Many of of clientes in the Real Estate Market in Andover, North Andover, Boxford and surrounding communities have found this free invaluable.
So here is the question that they all have wondered about and that is; what your neighbors house sold for and how many days did it take to sell their house? Are you curious about how many houses in your price range are on the market and for how long? What the listing price to sales price ration is for your market? In addition, it provides demographic information on schools, shopping, banking etc. It is published online once every 2,4,6 or 8 weeks. It is delivered to your email and you can be easily removed when you not longer want the report mailed to you.
Well, now you can easily find out this information which will make you a better informed consumer. We now provide a free service for our clients that allows them to receive a report call the Market Snapshot Report. This report can be used by a buyer who has a specific address in mind that they would like to purchase or the seller of a home. It zeros in on the local neighborhood and surrounding area or you can look at a larger geographic area.
Here is an example of a report for an address in the Andover, MA residential real estate market. The data contained in this report would show; for the week ending February 25th, 2012, there were 102 single family homes for sale in Andover, MA with an average listing price of $812,368, an average listing dollars per sq ft of $239 and average days on market of 139.38 days. Click on the link below to get a animated demonstration.
Contact me at Kathy Cyrier’s Email or 978-852-5811.


